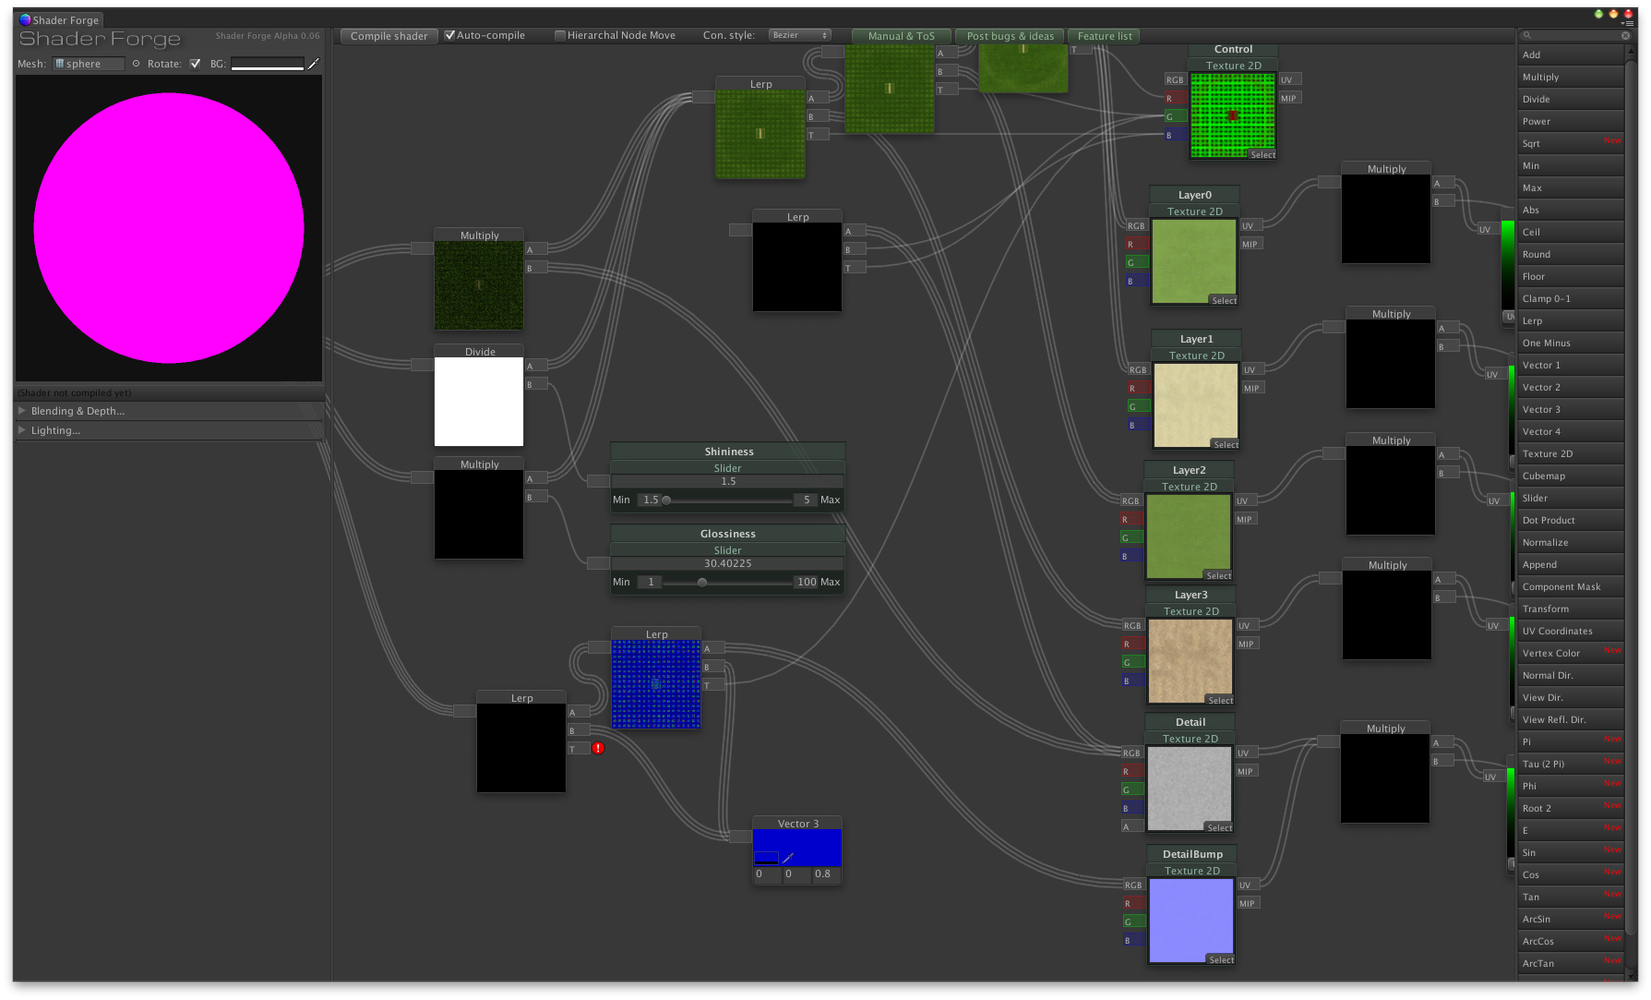
A0.06b - spamming unloading unused assets
When I open ShaderForge with a pretty large shader my log starts spamming like this.
System memory in use before: 362.5 MB.
Unloading 1 Unused Serialized files (Serialized files now loaded: 0 / Dirty serialized files: 0)
System memory in use after: 360.8 MB.
Unloading 522 unused Assets to reduce memory usage. Loaded Objects now: 6066.
Total: 14.093720 ms (FindLiveObjects: 0.397173 ms CreateObjectMapping: 0.428376 ms MarkObjects: 9.429632 ms DeleteObjects: 1.118088 ms)
System memory in use before: 362.7 MB.
Unloading 1 Unused Serialized files (Serialized files now loaded: 0 / Dirty serialized files: 0)
System memory in use after: 361.0 MB.
Unloading 522 unused Assets to reduce memory usage. Loaded Objects now: 6066.
Total: 14.247474 ms (FindLiveObjects: 0.413025 ms CreateObjectMapping: 0.414064 ms MarkObjects: 9.638255 ms DeleteObjects: 1.064526 ms)
System memory in use before: 362.9 MB.
Unloading 1 Unused Serialized files (Serialized files now loaded: 0 / Dirty serialized files: 0)
System memory in use after: 361.2 MB.
Unloading 522 unused Assets to reduce memory usage. Loaded Objects now: 6066.
Total: 14.538045 ms (FindLiveObjects: 0.404996 ms CreateObjectMapping: 0.437225 ms MarkObjects: 9.891943 ms DeleteObjects: 1.078204 ms)
System memory in use before: 363.2 MB.
Unloading 1 Unused Serialized files (Serialized files now loaded: 0 / Dirty serialized files: 0)
System memory in use after: 361.5 MB.
Unloading 522 unused Assets to reduce memory usage. Loaded Objects now: 6066.
Total: 14.070865 ms (FindLiveObjects: 0.418187 ms CreateObjectMapping: 0.469599 ms MarkObjects: 9.384135 ms DeleteObjects: 1.067433 ms)
System memory in use before: 363.4 MB.
Unloading 1 Unused Serialized files (Serialized files now loaded: 0 / Dirty serialized files: 0)
System memory in use after: 361.8 MB.
Unloading 522 unused Assets to reduce memory usage. Loaded Objects now: 6066.
Total: 13.838976 ms (FindLiveObjects: 0.402103 ms CreateObjectMapping: 0.421303 ms MarkObjects: 9.024645 ms DeleteObjects: 1.099405 ms)
System memory in use before: 363.7 MB.
Unloading 1 Unused Serialized files (Serialized files now loaded: 0 / Dirty serialized files: 0)
System memory in use after: 362.0 MB.

It may be related to the missing input on that Lerp at the bottom. When I loaded the shader (previously created in A0.05) the slider that was attached was somewhere off to the right (there was a line shooting off) I dragged across to the right for a while but did not find it, I then deleted the connection but I reckon the Slider node is still out there somewhere.
Customer support service by UserEcho


Sounds scary! Could you send me the shader?
yup, how do you want it, doesn't look like I can attach it here
http://hastebin.com/
http://hastebin.com/cedicotari.sm
There are only 7 sliders in the shader, there is none way off to the right. Try reconnecting a slider there, and see if the problem persists
Hmm yeah that seems OK now, I didn't want to do it earlier in case it hid a problem, I was playing in a much larger project that I have that quite often crashes Unity due to out of memory errors. perhaps this was nothing to do with SF after all. It definitely had a line shooting off to the right to something though... which I should not have deleted. If it happens again I won't make any changes..
There *is* a memory leak in SF currently though, which I'm currently looking into :) I'll mark this as fixed for now, if the problem persists in 0.07, let me know!
Cool will do