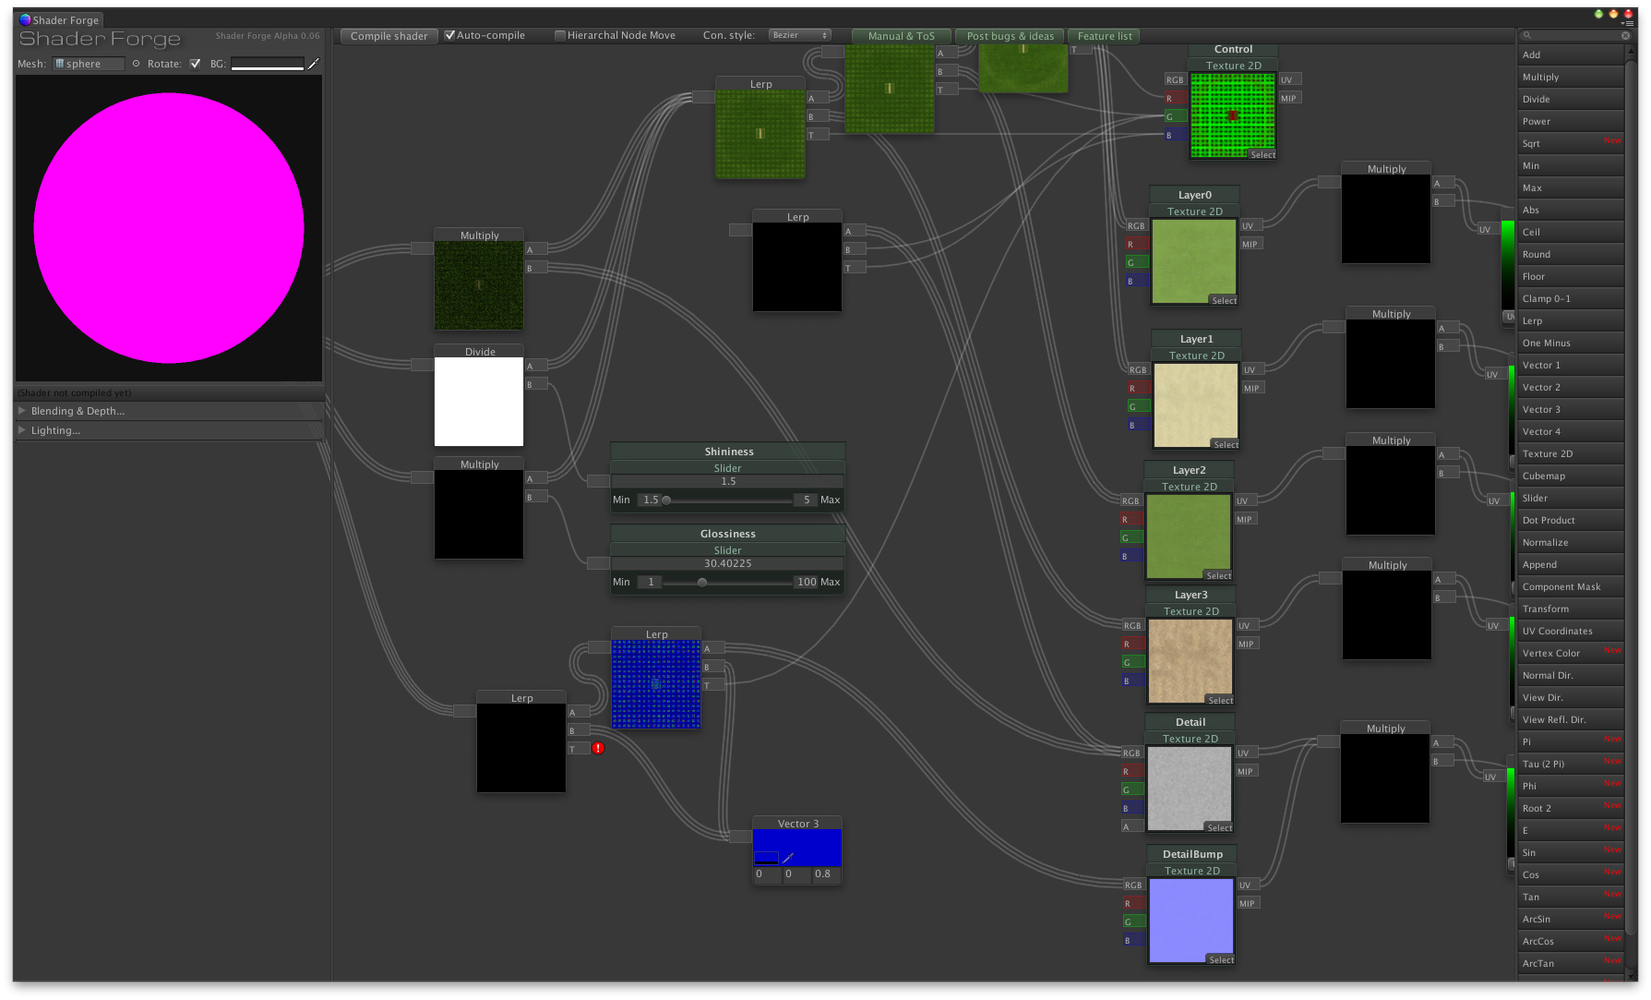
A0.06b - spamming unloading unused assets
When I open ShaderForge with a pretty large shader my log starts spamming like this.
System memory in use before: 362.5 MB.
Unloading 1 Unused Serialized files (Serialized files now loaded: 0 / Dirty serialized files: 0)
System memory in use after: 360.8 MB.
Unloading 522 unused Assets to reduce memory usage. Loaded Objects now: 6066.
Total: 14.093720 ms (FindLiveObjects: 0.397173 ms CreateObjectMapping: 0.428376 ms MarkObjects: 9.429632 ms DeleteObjects: 1.118088 ms)
System memory in use before: 362.7 MB.
Unloading 1 Unused Serialized files (Serialized files now loaded: 0 / Dirty serialized files: 0)
System memory in use after: 361.0 MB.
Unloading 522 unused Assets to reduce memory usage. Loaded Objects now: 6066.
Total: 14.247474 ms (FindLiveObjects: 0.413025 ms CreateObjectMapping: 0.414064 ms MarkObjects: 9.638255 ms DeleteObjects: 1.064526 ms)
System memory in use before: 362.9 MB.
Unloading 1 Unused Serialized files (Serialized files now loaded: 0 / Dirty serialized files: 0)
System memory in use after: 361.2 MB.
Unloading 522 unused Assets to reduce memory usage. Loaded Objects now: 6066.
Total: 14.538045 ms (FindLiveObjects: 0.404996 ms CreateObjectMapping: 0.437225 ms MarkObjects: 9.891943 ms DeleteObjects: 1.078204 ms)
System memory in use before: 363.2 MB.
Unloading 1 Unused Serialized files (Serialized files now loaded: 0 / Dirty serialized files: 0)
System memory in use after: 361.5 MB.
Unloading 522 unused Assets to reduce memory usage. Loaded Objects now: 6066.
Total: 14.070865 ms (FindLiveObjects: 0.418187 ms CreateObjectMapping: 0.469599 ms MarkObjects: 9.384135 ms DeleteObjects: 1.067433 ms)
System memory in use before: 363.4 MB.
Unloading 1 Unused Serialized files (Serialized files now loaded: 0 / Dirty serialized files: 0)
System memory in use after: 361.8 MB.
Unloading 522 unused Assets to reduce memory usage. Loaded Objects now: 6066.
Total: 13.838976 ms (FindLiveObjects: 0.402103 ms CreateObjectMapping: 0.421303 ms MarkObjects: 9.024645 ms DeleteObjects: 1.099405 ms)
System memory in use before: 363.7 MB.
Unloading 1 Unused Serialized files (Serialized files now loaded: 0 / Dirty serialized files: 0)
System memory in use after: 362.0 MB.

It may be related to the missing input on that Lerp at the bottom. When I loaded the shader (previously created in A0.05) the slider that was attached was somewhere off to the right (there was a line shooting off) I dragged across to the right for a while but did not find it, I then deleted the connection but I reckon the Slider node is still out there somewhere.
Kundesupport af UserEcho


Sounds scary! Could you send me the shader?
yup, how do you want it, doesn't look like I can attach it here
http://hastebin.com/
http://hastebin.com/cedicotari.sm
There are only 7 sliders in the shader, there is none way off to the right. Try reconnecting a slider there, and see if the problem persists
Hmm yeah that seems OK now, I didn't want to do it earlier in case it hid a problem, I was playing in a much larger project that I have that quite often crashes Unity due to out of memory errors. perhaps this was nothing to do with SF after all. It definitely had a line shooting off to the right to something though... which I should not have deleted. If it happens again I won't make any changes..
There *is* a memory leak in SF currently though, which I'm currently looking into :) I'll mark this as fixed for now, if the problem persists in 0.07, let me know!
Cool will do